


Geomean의 사용: Skewed data, scaled data,
- Population growth
- Compounding interest
- Bioassays
- Radioactive decay
- Dose-response relationships
- Count data
- Time Series data
- Longitudinal data
- Repeated measures data
- Bioequivalence trials
기하평균사용시의 조건: 0이나 음의 값이 있으면 안됨..
만약 그렇다면 어떻게 할까?
1. Adjust your scale so that you add 1 to every number in the data set, and then subtract 1 from the resulting geometric mean.
2. Ignore zeros or missing data in your calculations.
3. Convert zeros to a very small number (often called “below the detection limit”) that is less than the next smallest number in the data set.
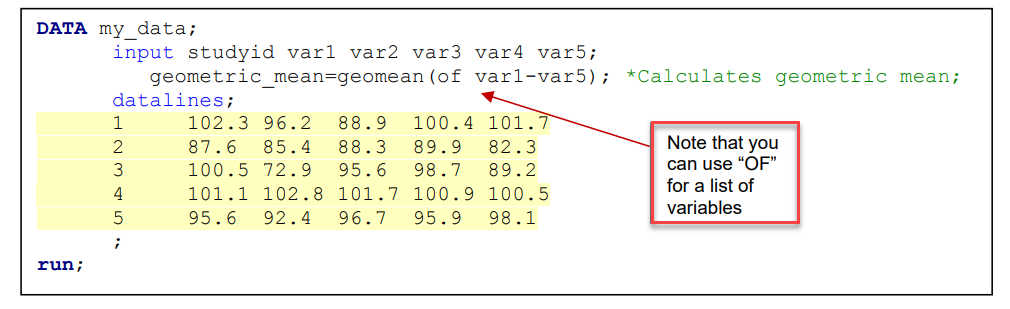
FINDING GEOMETRIC MEANS WITHIN AN OBSERVATION: GEOMEAN()/GEOMEANZ()
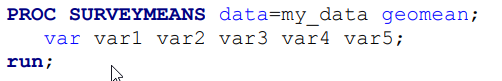
FINDING GEOMETRIC MEANS FOR A POPULATION
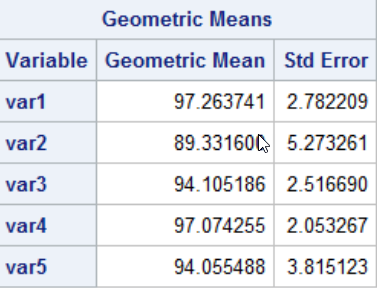
Geometric mean CV값
'통계 clinical trial > SAS' 카테고리의 다른 글
| [SAS] Proc ANOVA/ Proc ttest -ODS output p-value (0) | 2020.07.29 |
|---|---|
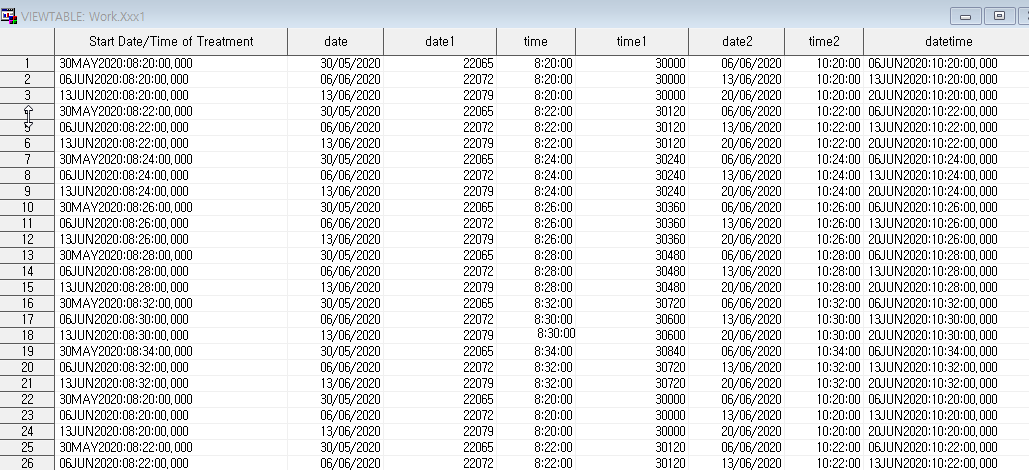
| [SAS] time, date 더하기, 빼기 (0) | 2020.07.28 |
| PROC REPORT (title page) (0) | 2020.07.27 |
| RM ANOVA (proc glm, proc mixed) (0) | 2020.07.21 |
| SAS Procedure 들 (0) | 2019.03.03 |

고향이안드로메다


 Accessing_R_Within_the_SAS_System_-_Alan_Mitchell.pdf